The What-if Analysis is a technique that is used to determine how projected performance are affected by changes in the assumptions that projections are based upon. In other words, it is the process of determining the effects on possible outcomes in a model, through systematic changes of some inputs, in order to verify the extent of the variations of some parameters and the amounts they can deviate from the expected values.
What-if analysis is used to generate different scenarios and values to determine a range of possible outcomes based on fluctuating conditions. In this analysis, key quantitative assumptions are changed systematically to assess their effect on the final outcomes. It is employed commonly in evaluation of the overall risks or in identification of critical factors and it paints different scenarios attempting to predict alternative outcomes of the same plan or method used for achieving a specific goal.
Overall, it is a type of analysis that can consistently contribute to make management decisions more effective, secure and informed, and is the basic level of data-driven predictive analytics.
Applying the concepts described above to ration formulation, with the aim of providing new operational procedures, the development group at RUM&N, has designed and implemented a new tool for recipe analysis and evaluation called What-If Analysis Tool.
The tool is designed to try out different inclusion amounts (scenarios) for the recipe ingredients or the DMI. The scenarios analysis evaluates the expected outcomes as a result of a proposed re-formulation activity. By creating various scenarios that may occur, the nutritionist can better determine the value of a different formulation on the expected nutritional and economical results.
Through this approach it is possible to compare, in a single screen, what impact the change of some inputs may have compared to others, dramatically increasing the decision-making process of the formulation.
Getting started
To open the What-If Analysis panel, click on the related tab of the recipe screen:

This opens the main panel organized in five sections, each with its specific data as following:


The height of each section can be changed and the lower three sections can be minimized using the related button.
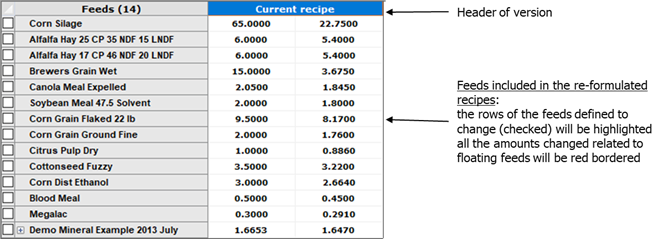
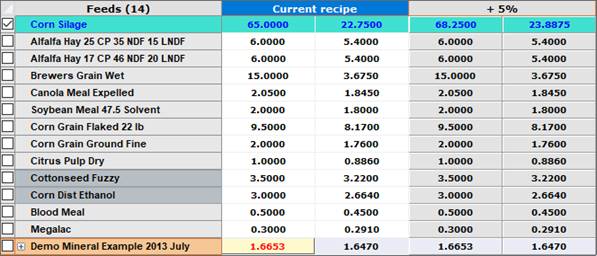
Data are also organized by columns; if we consider the first section, the first column contains the list of the ingredients of the recipe, beside it there are two columns with the AF and DM amounts of the ingredients. These two columns are grouped and labelled Current recipe, and their data match those of the initial recipe until some changes are made in the recipe tab. When more versions are displayed (after the analysis is made) data are shown with an alternate color of the background, to enhance their relation to a specific version:

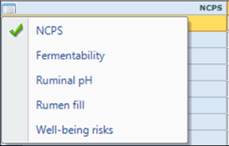
The model section can be customized in order to contain different sets of data, selectable through a context menu, after clicking on the upper-left cell of the grid with the right mouse key:

These sets of data are organized and displayed as in the main recipe screen.