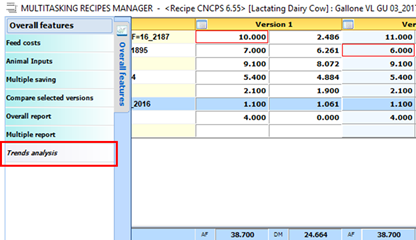

Trends analysis feature allows to examine through a bar chart the differences of nutrient and NCPS values between the versions of the recipe that you have made.
To access the feature, you have to click the relative option in the panel menu.
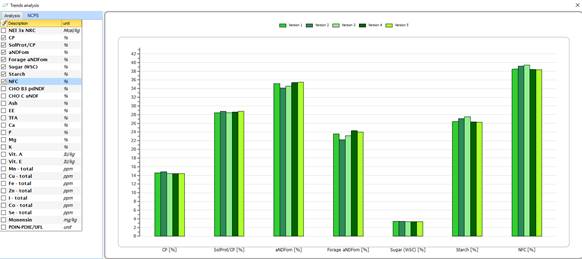
Nutrients
On the left of the screen you will find the list of the nutrients that you have chosen to see in the recipe.
You can tick any box to compare nutrients, for each nutrient the chart shows as many bars as are the versions of the recipe, that display relative values.
When you select and deselect a box, it automatically changes the chart; you can deselect all boxes through the button clear at the top of the list. Above the graph you find the legend.
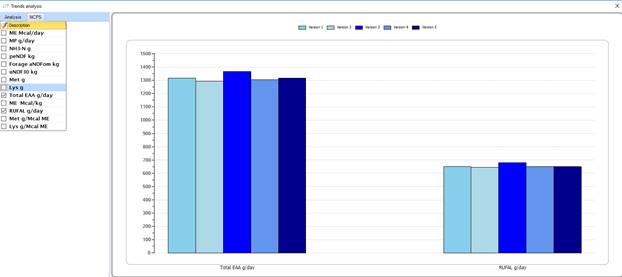
NCPS
You can switch to NCPS chart selecting the relative tab.
The chart works in the same way of Nutrient chart and, as the nutrients section, the list is the same you see in the recipe.