Subacute ruminal acidosis is defined as periods of moderately depressed ruminal pH (Beauchemin et al., 2003). It leads to a drop in acetate-to-propionate ratio, fiber digestibility, milk fat content, and DMI (Plaizier et al., 2008).
Maintenance of optimal rumen pH critically affects several important outcomes affected by ration formulation: optimal fiber digestion and thus feed efficiency, avoidance of butterfat depression, and avoiding pathological consequences of subclinical acidosis (SARA). These outcomes are all multifactorial, and not determined by rumen pH alone, but rumen pH is certainly a key and critical factor.
Rumen pH that defines SARA is not consistently defined and different pH threshold values are used. However, pH depressions below 5.6 to 5.8 are generally accepted as threshold values. The length of time per day when ruminal pH is under suboptimal levels seems a better determinant of depressed fiber degradation and presence of SARA than daily mean ruminal pH, or the lowest ruminal pH value.
Even though the time duration for which the ruminal pH must remain below this threshold value has not been precisely defined, ruminal pH of 5.8 is considered detrimental for rumen function, below which fiber digestion by the rumen microorganisms is suboptimal, and as a threshold for the development of SARA in dairy cows. However, it is assumed that the effects of ruminal pH on rumen function or SARA development depends on the duration of time in which pH remains below 5.8.
In order to minimize the risks of SARA, daily mean ruminal pH lower than 6.05 - 6.10 and a time length in which daily ruminal pH is below pH 5.8 longer than 5 hours or in which it is below pH 5.6 longer than 3 hours should be avoided.
In order to provide these assessments, the NDS Ruminal pH sub-model provides an estimate of the time below pH 5.6 and below pH 5.8.

Extent and severity of rumen acidosis
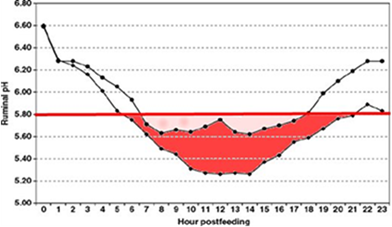
Rumen pH 5.8 was used as the threshold of acidosis. However, the duration of rumen pH below 5.8 reflects how long of the occurrence of rumen acidosis, but it does not reflect the extent and severity of rumen acidosis. With a view to better assess the acidosis status, the extent and severity of rumen acidosis should also be considered. Different extent of rumen pH depression can cause different responses, such as decreased fiber digestion (below 5.8), inflammation (below 5.6) and increased lactic acid production (below 5.2). Therefore, the effect of rumen pH depression to 5.7 for 3h may be different from rumen pH depression to 5.2 for 3h, for example.
For this purpose, the assessment of the area of rumen pH below 5.8 (AUC, pH x min/day) as an indicator of the extent and severity of acidosis has been recently proposed (Penner et al., 2007 - Penner et al., 2009 – Gao et al., 2014).


Area of pH below 5.8 was calculated by extent of rumen pH depression below 5.8 (5.8 – estimated minimum rumen pH value) * duration of pH measurement interval (h/day). For example, if the minimum rumen pH was estimated at 5.6, then area below pH 5.8 would be (5.8 – 5.6) * duration = 0.2 * time below pH 5.8. Area is used to reflect the extent and severity of rumen acidosis.

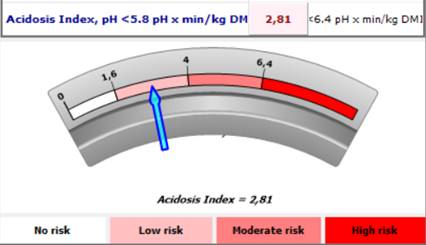
However, differences in feed intake may have different effects on rumen pH for animals, so that it seems sensible to normalize the parameter based on the DMI, in order to define a homogeneous Acidosis Index. Therefore, Acidosis Index was calculated by dividing the area of rumen pH below 5.8 by current DMI to evaluate the severity of rumen acidosis normalized for DMI. In the field, the occurrence, duration and severity of acidosis may be enough to evaluate the condition of rumen acidosis. Nevertheless, variation in individual animal effects and responses to rumen acidosis are found in practice (tolerant animals), and it is useful to account for factors causing this variation among animals. Using the proposed acidosis index, could remove the confounding effects of DMI on rumen pH, which helps to evaluate and target whether the severity of rumen acidosis is related to differences in other factors, such as VFA absorption and neutralization in the rumen.
It is proposed a goal of Acidosis Index < 6.4 pH x min/kg DMI to describe low to moderate SARA risks.

Rumen pH fluctuations
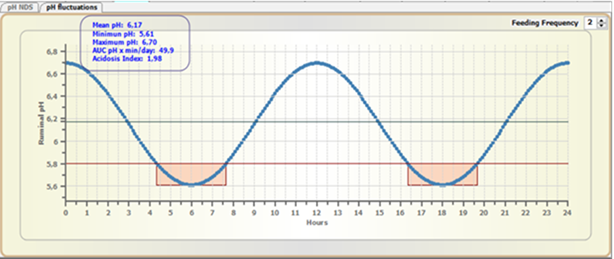
Even under steady-state conditions, we know that rumen pH can fluctuate throughout the day as a result of several nutritional and managerial aspects among which diet composition, feeding frequency, number of meals, feeding rate, etc. Thus, it may be interesting to simulate the pH fluctuations in order to evaluate how the ruminal parameters that we consider to be indicators that may lead to subacute ruminal acidosis (SARA) are expected to change.
The NDS pH sub-model is enhanced with a tool able to graphically simulate the daily fluctuations of the rumen pH, based on minimum pH, maximum pH and feeding frequency.
By changing the feeding frequency, it is able to visualize the expected daily fluctuations and the consequent changes in the main ruminal parameters such as the AUC as pH x min/day and the Acidosis Index.


It is important to underline that this tool have to be considered only a simulation tool able to provide some indications about rumen pH changes during the day, in relation to the feeding frequency (and the related number of meals) and the expected variations of the main pH parameters.