The goal of the sensitivity for a sub-optimal solution (a solution violating one or more constraints on the analysis values, model parameters or total DMI) is to find out which constraints for the feeds can be moved to direct the optimizer toward better solutions in terms of optimality.
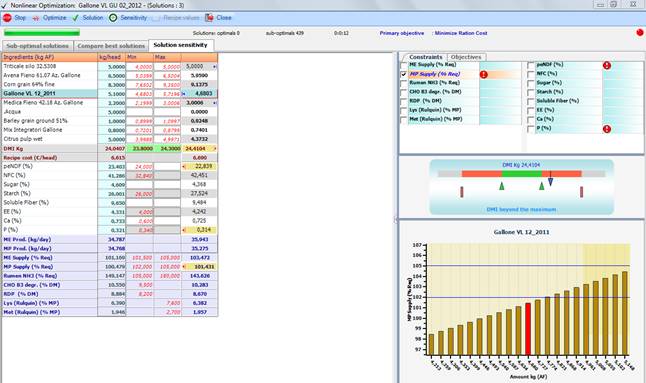
After selecting a sub-optimal solution and clicking on the Sensitivity button, a new tab is opened to display the following screen:
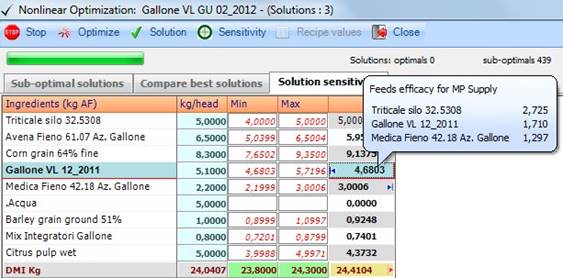
The first five columns on the left summarize the current state of the selected solution; the original recipe data are also shown to allow a comparison with the solution; the constraints that are violated are highlighted in the solution column and those feed amounts that are on the min or max bounds in the solution are marked with the specific blue symbols:
![]() = Ingredient
amount set to the minimum bound;
= Ingredient
amount set to the minimum bound;
![]() = Ingredient
amount set to the maximum bound.
= Ingredient
amount set to the maximum bound.
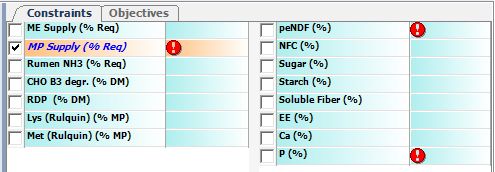
In the upper right corner of the screen two lists display model and analytical parameters selected. The items with a constraint violation are marked with an exclamation symbol; among these you get a tickbox checked, to point out that it is the most important violation or, in other words, the larger or more severe violation; note that model violations are always considered more severe than analysis violations.
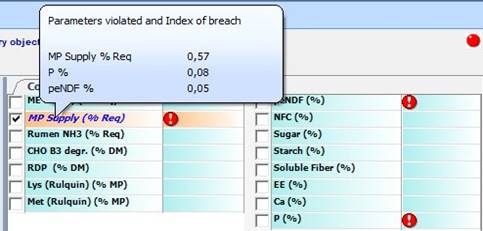
To get further information about the severity of the violations (if more constraints are violated) you can locate the mouse pointer over one of the violated parameters and have a tooltip displayed with the list of the parameters ordered by importance; beside the name of the item, a numeric value indicates how severe is the violation (Index of breach).
In the lower right corner of the screen a chart shows the dependency between the most violated parameter and the amounts of the feed, chosen among those that are set on a minimum or a maximum bounds, and evaluated as the most effective in changing the parameter value (this choice is related to the capability of the feed to change the parameter and the feed cost). The values of the parameter are displayed as bars of different height, each one corresponding to a different amount for the feed; the bar related to the current amount for the feed in the solution is rendered in red. As the mouse pointer is located over a bar, a tooltip is displayed with the corresponding value for the parameter and the related feed amount. When a minimum and a maximum are set for the parameter, two horizontal blue lines are displayed in the chart, to help understand how the amount of the feed can be changed to satisfy the constraint or, at least, to reduce its violation.
When the mouse pointer is located over a feed in the list that is set on a maximum or a minimum bound, a tooltip with a list of the feeds ordered by their effectiveness in changing the violated parameter is displayed. Moreover the name of each feed an index of the feed effectiveness is reported (Index of efficacy). Note that the index is also related to the cost of the feed, and among feeds that are similar in terms of capability of modifying the parameter by changing their amounts, the cheapest will be on top of the list.
After clicking one of the feeds of the solution that are set to a minimum or a maximum, the chart is updated to display how the selected parameter can change by setting the feed amount to different values. In this way one can compare the effects of different feeds and change the amount of that (those) more suitable to his needs.
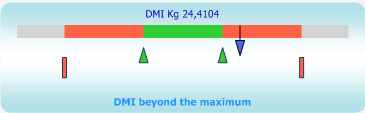
In the middle of the right side of the screen a dashboard chart gives the state of the total DMI amount in the solution. The pointing down arrow marks the current amount for the solution; the total DMI range is rendered in green and there are also two extra-ranges rendered in orange to show the state of the total DMI when its amount violates its minimum or maximum constraint.
Clicking on a bar with the left button of the mouse determines a change of the feed amount in the solution (actually the original solution does not change; a new solution with the feed amount changed is created and displayed beside the original one); the selected bar is then coloured in blue, and three additional columns are displayed to show how the solution data change accordingly. The first column shows the data of the solution after the change, while the other two columns show the differences between the modified solution and the original solution in absolute and percentage values. After clicking on a bar in the chart and displaying the additional columns three actions are available as commands in a context menu, displayed by clicking the left button of the mouse on the header of the first additional column:
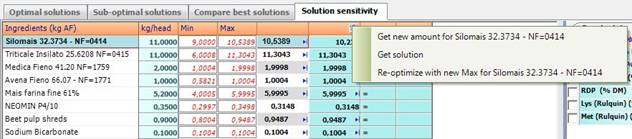
1. Get the new amount for the selected feed: with this command the feed amount is changed in the original solution; after this step a new sensitivity for the solution is calculated and the content of the sensitivity screen is updated accordingly (e.g. the three additional columns are removed). This step can be repeated after selecting another amount in the chart.
2. Get Solution: the solution with the modified amount for the selected feed is brought into the recipe.
3. Re-optimize with the new Max or Min for the selected feed: the constraint for the selected feed is changed by setting the min or the max to the changed amount; then a new optimization is performed according the modified constraint.
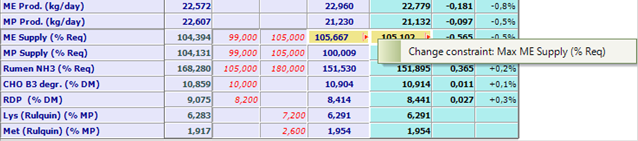
Another way to change the constraints before re-optimizing is to right click the solution columns (the fifth column or the sixth if a bar has been clicked) and executing the Change constraint command from the context menu.