The Proportionate table check controls the total width of the table.
If the Proportionate table check in a table’s properties form is checked, the table in the report will fill the maximum horizontal space available in the report: this means that, if the selected table has no table on the right, the table will fill all the report’s width.
When you drag a table on the right of another table, the two tables will automatically be proportioned. This is necessary to prevent that the total width of the two tables is greater than the report’s width.
If you remove the Proportionate table check from one of the two flanked table, the proportionate table will reduce (or increment) his width, in order to let the not-proportionate table fill his total width.
Note: the total width of a not-proportionate table is equal to the sum of his column’s width. In order to change this width, you have to change the columns width in the Properties of the table.
If you remove the Proportionate table check from both the two flanked table, and if the total width of the two tables is greater than the report width, some part of the table on the right may not be displayed.
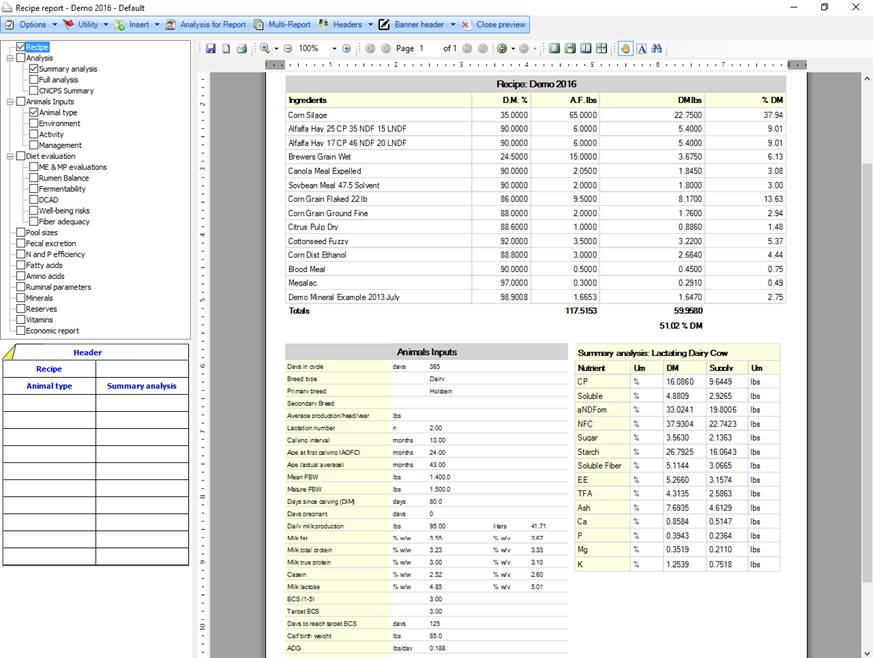
Example à Animal type and Summary analysis are flanked and both are proportionate:
This is what happens if you remove the check from both the tables:
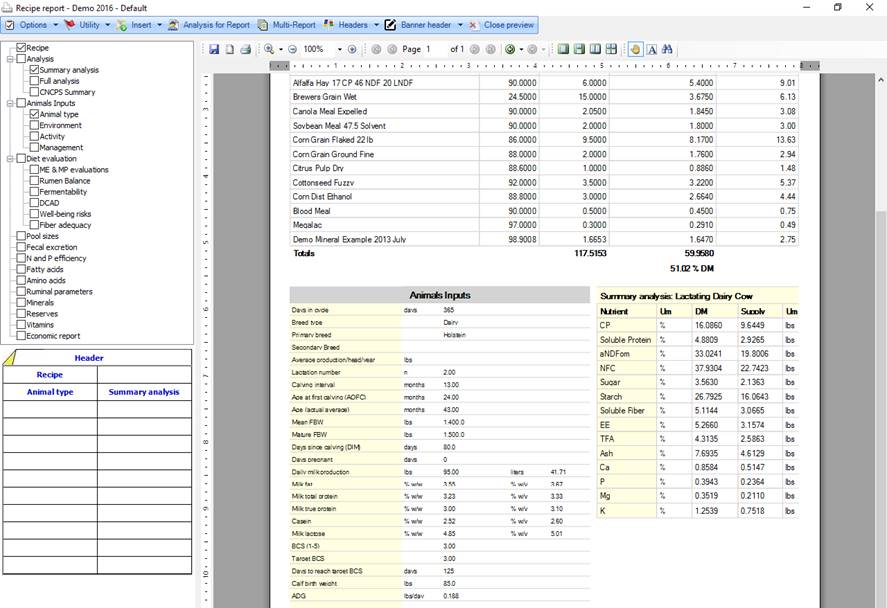
You can notice that in the Summary analysis table, the last column is not correctly displayed because the total width of the two tables is greater than the report width.
To fix this problem, you can:
- check the Proportionate table in one of the two tables;
- check the Proportionate table in both tables;
- reduce the stable total width (removing columns or reducing column width).