

After selecting and activating a specific farm, a screen like the one below opens. Under the graphic below is a description of each of the sections which are labeled in numbered red text, and of the adjoining input fields to their right. Below the descriptions of the Pen info and inputs, specifics of how to use and interpret details in each section are presented for Economic Outcomes as a glossary. Please follow though the text below for a tour of what the sections are.
#1 Utility: The top section contains three buttons on the left, and three boxes on the right.
Buttons for three utility functions at the upper left:
1. The Report button will be used to create and print a report after you have reviewed the onscreen report. Report formats include Rich Text, Excel, and PDF formats.
2. The Excel button creates an Excel file with the Economics report.
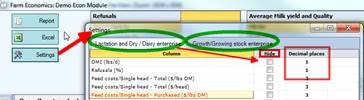
3. The Settings button permits customizing the screen for the Dairy and Growing animal sections separately; specific report fields can be hidden/removed and shown to different decimal places.
Refusal Box: To the right of the buttons is a box for entering the average refusals (orts) across all lactating pens and across all pens containing growing animals. After entering the overall refusal levels, clicking on the Get refusals data button will populate all the appropriate Refusals % fields for all pens with the data entered in this box. Alternatively, the refusal levels can be custom entered to each pen individually in the Refusals % column for a pen in the report grid.
Milk & Component Yield Box: The next box to the right in the Utilities section is for entering the overall herd level milk production and components. The default values for individual pens are the values set in the animal inputs for the recipe assigned to that pen. The specific milk weights and components can either be left at default (Animal inputs for the ration), set to a uniform amount across all the herd by entering data here and clicking the Get yield data button, or can be updated to pen specific amounts in the pen rows below by overwriting the default values brought in at startup. Users who choose to use individual pen milk weights (which provide economics outcomes to evaluate specific pens/ration) should make sure that the overall herd milk yield on the Lactating summary row matches the lbs./cow the herd is actually shipping, else adjust the pen milk(s) so it does match.
Milk Prices: (NDS accommodates two Milk Pricing Systems, US and International)
1. US users: Class III prices box: Toward the right side the milk prices box appears showing the most recent Class III prices available in your copy of NDS. The top line shows the date of the month which corresponds to the Class III prices shown. These are the prices that will be used to calculate milk values. Note that pricing and related economic fields are explained in the Glossary document which is a companion to this tutorial. US users are referred to the Glossary – “US FMMO Class III” version.
To access and update Class III Milk Prices manually, leave the Economics Module, and on the Main tab go to Farm Structure, select a farm name on the left, click on the multiple component pricing tab on the right. From here the current Class III prices can be downloaded or entered by hand. The downloaded prices apply to from the first of each month until the next download.
2. International users: Milk & Component Prices: In most countries milk pricing systems are not based on the US Federal Order Class III system. The Economics module accommodates other pricing systems when it is set to International Prices, and the price fields available to use in the calculations appear in this box. Note that pricing and related economic fields are explained in the document which is a companion to this tutorial. International users are referred to the Glossary – “International” version.
#2: Pens & Rations: Lactation & Dry
a. Lactating and Dry Animal Info is the next section, and is located below the “1: Utilities” label (at arrow → in left margin below). Lactating and Dry Animal Info loads with the most recently saved ration for each pen in the farm structure of the selected farm. At opening of the module, the number of animals defaults to the number of animals on the Animal inputs tab for this ration at the last save, and the dry matter intake (DMI) is the amount in the ration at the last save. For any pen both the DMI and the number of animals fields may be changed on the Economic Module screen.
b. Refusals: Note that there is a Refusals amount field which loads empty – it loads empty because there is no place in the ration or the animal inputs to enter this. Refusals, because they have a cost, should be accounted for in estimating overall profitability. This can be done by entering pen specific refusal amounts in the corresponding field for each pen, or by applying an overall refusal amount from the Refusals utility box as described above.
c. The ration shown for a pen at startup is the most recent saved ration for that pen. However, the ration used for a pen in the Economic Module can be changed to a different ration that is assigned to that pen that was saved earlier. To change the default ration loaded, click on the ration name, and the field with the ration turns into a dropdown list box with other rations assigned to that pen. Simply select the desired ration and the cost fields etc. will recalculate. Depending on how many pens are set up in the farm that are fed the same ration, users might want to consider using the Feeding to... utility button (on the ration screen) to add a ration to another pen where it is fed at a different DMI for instance.
d. Remove Unused Pen from Report: Parking all the rations assigned to a specific pen will remove the pen from the Economic Module report.
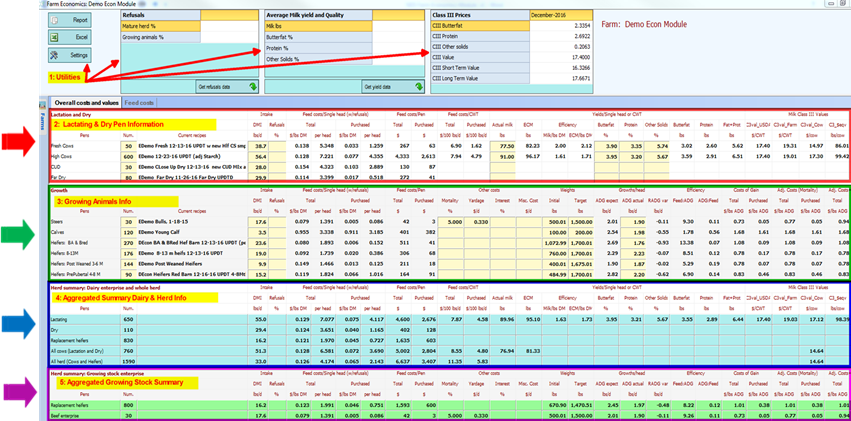

e. Feed Costs: for lactating animals, to the right of the Intake and Refusals fields are the feed costs for the ration. Feed costs are calculated from the ration, and are based on the ingredient costs and amounts active for the ration at the time the ration was saved.
f. On the Economic Module Feed Costs tab, these prices will be both visible, and changeable.
g. Milk Yield & Milk Composition fields are located to the right of the feed cost fields in this section. These fields will populate by default with the values from the ration animal inputs tab when the Economic Module is opened. However, users can manually overwrite the fields with yellow backgrounds with updated values for actual milk yield and fat, protein, and other solids values. The program then calculates the correct yield amount for each component, and applies the milk prices visible in the utility box at the top to those amounts to calculate the milk value.
#3 Pens & Rations: Growth
a. Information for all pens containing growing animals is in the section to the right of the green arrow → next to the screenshot of the Economic Module above. This section is intended to provide economic evaluation for heifer enterprises, and can also be used for beef operations.
b. Pen name, number of animals, ration name, DMI, and refusals all function similarly to the comparable fields in the Lactating & Dry section above. Also, as above, fields with yellow background can be overwritten to current and more accurate values as of the time the report is prepared (as opposed to the default, which is animal inputs when the ration was last saved). Like the Lactating and Dry section, rations used in the economic evaluation can be selected from other rations assigned to that pen by clicking on the ration name and selecting from the list box that appears.
c. Feed Costs are defaulted to the last saved ration, as described above for the Lactating and Dry rations.
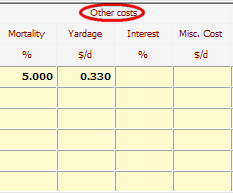
d. Additional Costs: Beef and custom heifer growers typically have additional costs beyond feed costs that are charged against individual animals. These other charges appear to the right of the Feed Costs/Pen fields of the Growth section, and are applied to individual animal fields such as Total or Purchased cost/head. Where single head prices are aggregated across the pen etc., these “additional costs” are also aggregated with the base ration costs when applicable. The economic outcomes that utilize these other costs are defined in the glossary at the end. Briefly, the Mortality is the percent death loss in the pen. If the user enters a 5 percent death loss, the cost per head is adjusted to cover the cost of the animals in the pen plus 5% additional to cover the cost of animals who start and incur feed cost, but that die before leaving the pen. Their costs are threfore assigned to the remaining animals. Similarly, many operations calculate a yardage cost, which is a compilation of miscellaneous daily costs charged to animals in the pen for things such as labor, equipment use, etc. If the yardage charge is $0.50 /day for example, then $0.50 is added to the feed cost /head per day to arrive at a total cost/charge per day.
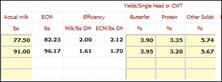
e. Weights: Initial & Target ; Average Daily Gain In the image at right from the Growth section the two leftmost columns are animal weights. These weights are used to define the weight at which animals enter the pen, and the weight at which animals are expected to leave the pen. Using these weights, and the ADG actual - Averge Daily Gain actual (ADG), the program caculates an expected “Days On Feed” which is the time required, at the current ADG, to go from the initial weight to the target weight. The fields are initially populated with values from the Animal Input tab for the ration used for that pen. The default initial weight is the “Current Full Bodyweight, and default Target weight is the Mature Weight. Note that there are two columns with values for ADG, one “expect” and one “actual” The ADG “expect” is the value for ADG calculated on the Animal Inputs tab. The ADG “actual” is the first limiting ADG of either ME allowable gain or MP allowable gain. As for some of the Pen info fields, note that three of these columns have yellow backgrounds, which means the values in the fields can be overwritten by the user.
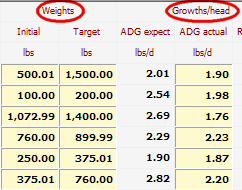
f. Weight Inputs: Users will almost always want to overwrite the initial and target weights. The reason is that on the animal inputs tab it makes sense to enter the average weight of the animals in a pen over the period they are consuming the pen diet. If we entered the initial weight when we formulated the ration, we would end up with too low a DMI because on average the animals will be about half way between the entering and leaving weight for that pen – over time in the pen they will not remain at the initial weight. But here on the Economic Module fields for growth, we should use the weight at the entry to the pen, and the weight expected at leaving the pen. This allows the program to calculate the expected days on feed (the days to go from the intial to the target weight when growth per day is at the “actual” ADG). Note that when formulating for growing animals, the ration “Animal Inputs” screen has a listbox where the user can choose to formulate for ADG by period, instead of using the Target system, or using a scale weight and manually entering the ADG.
#4 Aggregated Summary Information
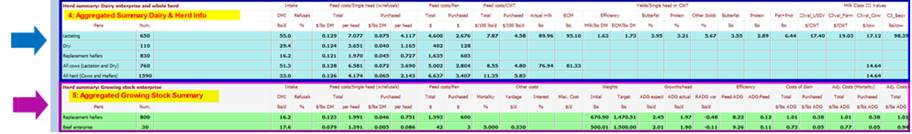
The lower two panels of the Economic Module are summaries across the herd by pen types. Because of the aggregation / summarization across the entire herd this section is especially useful for evaluating herd level performance.
For instance, costs and economic outcomes for all of the lactating pens are summarized in the Herd summary: Dairy enterprise and whole herd section in the row labeled Lactating. Each item in this row is either a summary of data in all the pens for lactating cows above (Num. for example), or a weighted average of data from the lactating pens (Actual milk, or Butterfat % for example). Similarly, the bottom section labeled Herd Summary: Growing stock enterprise aggregates the data on the overall growing animal pens. For instance, in the Replacement heifers row of the Herd summary: Growing stock enterprise section we see a weighted average of the ADG for all growing heifers, including the calves.
a. Herd summary: Dairy enterprise and whole herd: In many cases, financial advisors will want to aggregate all expenses and returns across the entire herd (All herd, Cows and Heifers row); however, when a dairy does not raise some or all of their replacement heifers it is difficult to compare performance across herds since not all herds will have the same expenses for replacements. Therefore, the row categories in the summary section allow assessment of subcategories of animal types in the herd. The row All cows (Lactation & Dry) is straightforward, and for a herd that uses a contract heifer grower for all or only some of the heifers, the consultant and producer may prefer to monitor the herd All cows (Lactation & Dry) row since their heifer enterprise expense is not comparable with most other producers who are raising heifers.
b. Note that fields that are not applicable to a given animal type are left blank, such as the column Actual milk, which is aggregated for Lactating cows, and also for the total mature herd All cows (Lactation & Dry), but is not summarized for Dry cows, Replacement heifers, or All Herd (Cows and Heifers).
c. Herd summary: Growing stock enterprise: Aggregates the inputs and economic outcomes for all growing animals. This is fairly straightforward for Dairy operations with growing heifers. The heifer pens show up in the Herd summary: Dairy enterprise and whole herd” section in the row labeled Replacement Heifers and in the All herd (Cows and Heifers) rows.
d. Beef Enterprise: When an operation is a beef operation and there are no cows, as on a feedlot for example, only the applicable rows (based on the pen definitions) will be visible. For instance, in most feedlot situations the “Lactation and Dry” header sections will be present, but there will be no pens / rows listed. For Cow Calf operations, the cows can be entered as Dry Cows or as lactating beef cows. At present the Econ Module does not handle beef cows (as opposed to steers) smoothly, this will change as the program is refined.
#5 Feed Costs Tab
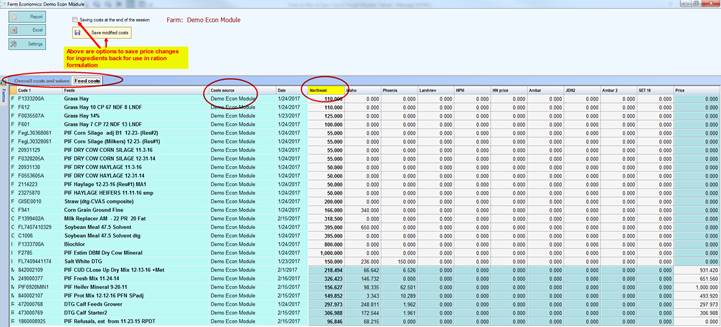
The Feed Costs tab can be clicked open at any time after a farm has been opened in the Economics Module. To return to the Economic report grid, simply click on the Overall Costs and Values tab.
Costs Source field defaults to the Ingredient list used when the rations was saved. Any ingredient can be set to a different source by clicking on the Cost Source for that specific ingredient ans selecting any other list.
Price Sets to the right of the date field are the same price sets that are accessible from the Costs tab inb NDS after clicking on the Update Costs button on that tab. The default when the farm opens is whatever cost set was set as the active cost set when the most recent ration was last saved. Users can choose a different cost set to apply from inside the Economics Module simply by clicking on the title at the top. The title will turn yellow, and those prices will be applied when back on the Overall Costs and Values tab of the Econ Module.

Note that prices can be changed in any of the white cells. For most Mixes, there is a price applied that is likely different than the price calculated from the ingredients, such as a selling price which includes the profit margin, transportation etc., and these are changeable at the lower right.
Saving Price Changes Back to NDS to save price changes made during the session at the session end check the checkbox labeled for that at the top left region. Price changes can also be saved manually by clicking the “Save modified costs” button at any time during the session.