This graph shows values of the recipe’s Ingredients. You can choose which type of value display in the graph.
To add/remove the graph to the report, you can:
- right-click on the Recipe in the Report Preview grid and select Insert Ingredient graph (or Remove Ingredient graph);
- in the Recipe properties, check or uncheck Insert Ingredient graph.
Note: Ingredients graph is always shown on the right of the Recipe table. If you have another table on the right of the Recipe and you add the graph, the table will be moved in the first free space of the report.
The graph’s width and height are based on the Recipe table: to enlarge the graph, you need to reduce the recipe width.
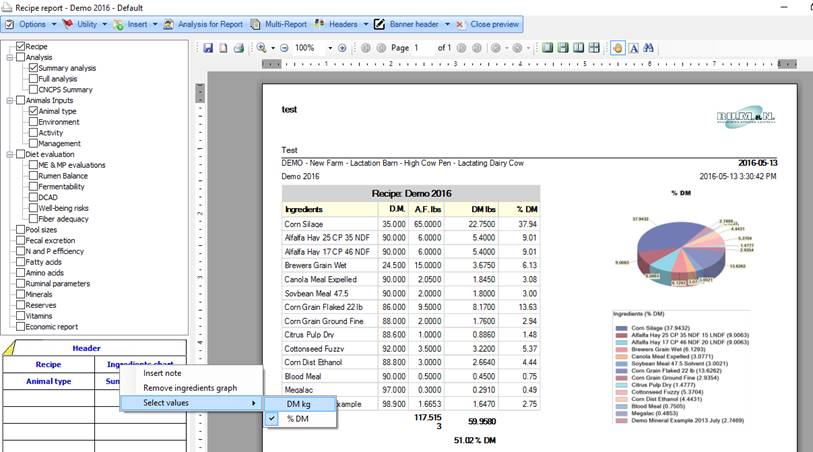
Here’s how the Ingredients graph and his properties look like:
You can notice that if you right-click on the Ingredients graph in the Report Preview grid, you can remove it or select which values to display.