The model is included in the Animal inputs tab of the Recipe feature and, through some specific inputs related to the pen where the recipe is fed, it is able to provide several output evaluations that should design, for the analyzed pen, the current scenario about the social interaction on resting time, DMI prediction and rumen pH adjustment.
MEM – Inputs
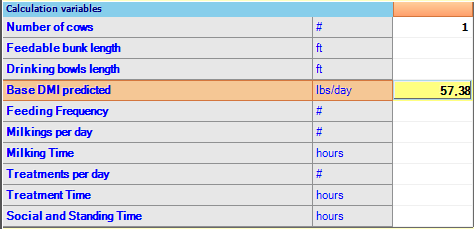
- Number of cows: number of animals currently present in the pen;
- Feedable bunk length: total feed bank space available for the pen;
- Drinking bunk length: total length of drinking bowls available for the pen;
- Base DMI predicted: it is not an input. It shows the DMI predicted by requirements as an average between Min DMI predicted (by CNCPS equation) and Max DMI predicted (by NRC equation);
- Feeding Frequency: number of daily time the fresh feed is delivered. The frequency of feed push-ups is not considered;
- Milking per day: number of times of milking each day;
- Milking Time: time spent in transit to parlor, holding area, in parlor being milked, and time to travel back to the pen each milking
- Treatments per day: daily frequency cows are locked in for managerial activities like vet checks, health-treatments, hoof care, etc.
- Treatment Time: time spent locked each treatment;
- Social and Standing time: total daily time spent for social interactions and standing in the alleys. It doesn’t include the physical act of drinking and the majority of time spent in the alley in a free stall pen appears to be voluntary for transfer between the resting and feeding area and socializing. According suggestions from Rick Grant, the time should be 2/3 hours and recent observations of behavior data of 205 lactating dairy cows housed in 16 free stall barns in Wisconsin (Gomez et al., 2010) shows that standing time has been 2.5 hours in average.
MEM – Outputs
Once the required data inputs are set, several evaluations and predictions will populate the output grid.
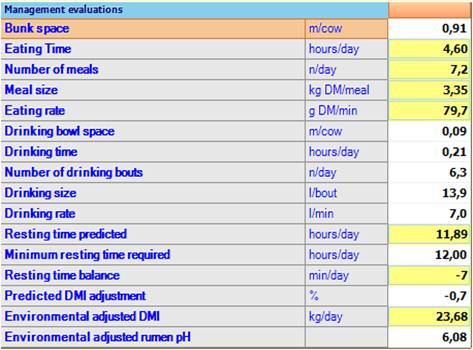
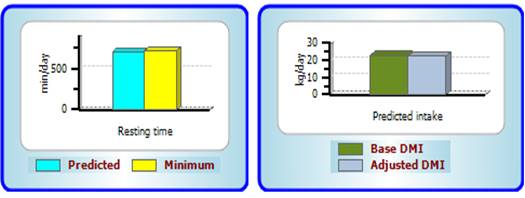
In addition to the feeding behavior of the cows in the pen, the most important output is related to the resting time. The model is able to predict the resting time, comparing it with the minimum resting time required, that is considered to be 12 hours, generating a resting time balance prediction.
A negative resting time balance leads to a negative DMI adjustment used to adjust the predicted DMI according to the defined non optimal environmental conditions.
Also, the mentioned non optimal environmental conditions, may affect rumen health driven by pH.
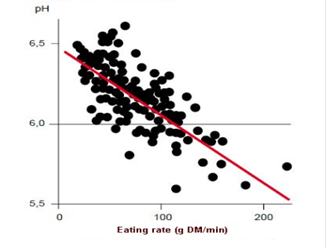
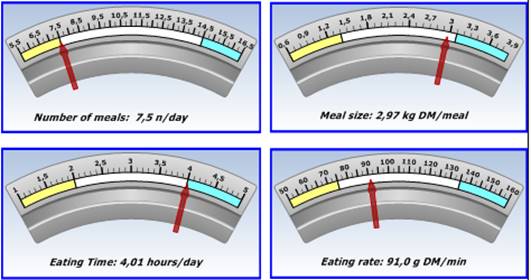
Meal size (kg or lbs of DM/meal) is predicted from resting time and there is an interaction among meal size, number of meal and eating rate (g DM/min). When evaluating these parameters, a pattern emerges that, as the number of meals per day decreases, the meal size increases and the eating rate also increases. MEM model utilizes these relationships to adjust the NDS rumen pH, giving an idea whether rumen health is potentially compromised under overstocked conditions.
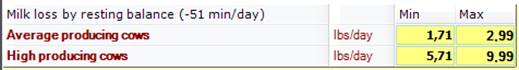
Other potentially interesting outputs that MEM model is able to provide, are related to the milk we can expect to lose by negative resting balance in terms of a min/max range of milk we might lose both for average producing cows and high producing cows.
The most relevant output values are also presented graphically for a better comprehension:
Also, a detailed report can be printed out through the Report MEM button: