Inputs
Even though the fresh grass intake by cattle and the effects on performance production is a complex system and it is influenced by a range of factors, including the milk yield potential, body weight, age, reproductive stage and innate grazing behavior of cattle, the quantity of herbage available to the animals, its quality (digestibility) which affects the rate of passage through the rumen, and also the uniformity and botanical composition of the herbage in the sward, we tried to minimize the input of the information needed in order to facilitate the tool usability.
Inputs required for each feeding period:
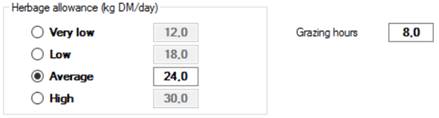
- Herbage allowance (HA ) - kg or lbs DM herbage offered/cow/day. Herbage allowance is defined as the amount of herbage above a specified sampling height allocated to livestock (kg or lbs DM/cow per day) on the current pasture. At low HA, non-nutritional factors related to pasture structure determine PDMI. In contrast, at high levels of HA, PDMI increases at a progressively lower rate as HA is increased. It has been identified as a major factor influencing DM intake and livestock performance. A high plant density results in a higher intake level because the animal can stand in one spot in a pasture and graze from many plants. At the opposite, a thinner stand will result in a lower intake because the animals need to spend more time walking around and looking for plant to graze.
This parameter can be predefined by default as very low, low, average and high. However, it can be customized by the user under each unique grazing conditions, whether more information is available.
- Grazing hours – hours/day of access to the paddock. It is the amount of time available for grazing or the daily time spent grazing by livestock.
Outputs
The outputs of the Grazing tab have different sections providing a range of useful information to evaluate the DMI of grazing animals receiving the recipe we are formulating.
Summary DMI
The grid includes the DMI expected for each of the macro components feeds offered:
Ø Grazed herbage
Ø Partial TMR (if offered)
Ø Supplement (if offered)
Ø Extra-forages (if offered)
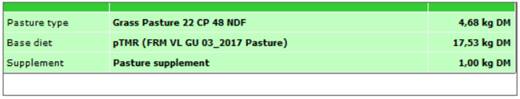
These data provide an idea of how the total DMI is obtained.
Herbage DMI details
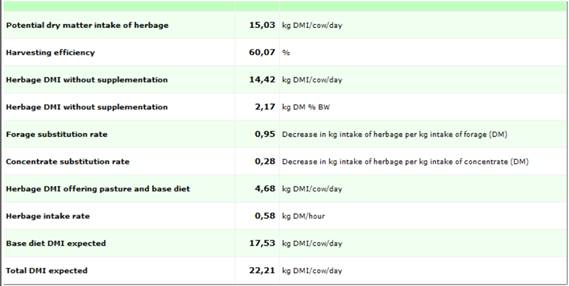
The grid provides the main details in order to understand how the model predicts the herbage DMI:
Ø Potential dry matter intake of herbage (PotDMI kg or lbs DMI/cow/day) - upper limit to potential herbage DMI for animals offered only pasture, which is the minimum out of two limits: (i) physical limitation related to rumen fill, (ii) ‘grazing limit’ related to ingestive constraints that is the total DMI predicted by the model.
Ø Harvesting efficiency (HE %) – it is the efficiency of grazing predicted by the ratio HA:PotDMI. It measures the pasture offered relative to the cow’s demand for pasture at grazing. It is expected that, as HA decreases, herbage DMI/animal decreases, but grazing time and the efficiency of grazing increases.
Ø Herbage DMI without supplementation (kg or lbs DMI/cow/day) – it is the herbage DMI of animals offered only pasture and it is obtained by multiplying HE times HA. This value cannot be greater than PotDMI, otherwise it is set equal to PotDMI, because at high HA, nutritional factors such as herbage quality and the metabolic demand of the animal appear to be less relevant and intake appears to be mainly controlled by rumen fill. This value is also shown as % BW.
Ø Forage substitution rate - when extra-forages are offered, the herbage DM intake of animals may decrease. Forage substitution rate expresses the decrease in kg or lbs DM intake of herbage per kg or lbs DM intake of extra-forage intake. It is based on the fill effect of the extra-forage compared to the grazed pasture and predictions are driven by uNDF content of the forage involved.
Ø Concentrate substitution rate - when supplements are offered, they partially replace herbage DM intake. Concentrate substitution rate expresses the decrease in kg or lbs DM intake of herbage per kg DM intake of supplement. It is based on herbage DMI before supplementation expressed as % BW.
Ø Herbage DMI offering pasture and base diet (kg or lbs DMI/cow/day) – when grazing animals are also eating pTMR and/or supplements and/or extra-forages.
Ø Herbage intake rates – herbage DMI/hour spent grazing.
Ø Base diet DMI expected – DMI of pTMR, supplement (if offered) and extra-forages (if offered)
Ø Total DMI expected – total of herbage DMI and base diet DMI.
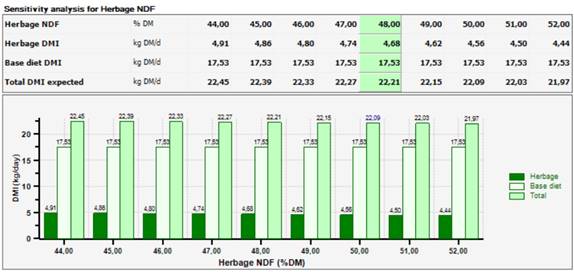
Sensitivity analysis for herbage NDF
Physical and physiological factors regulating feed intake change in importance with increasing herbage quality. NDF is an important nutritional factor through its effects on digestion and rumen fill, described in the tool by the forage indigestible NDF (uNDF) content (%NDF), with a lower rate of digestion and higher rumen fill as uNDF in the diet increases. At high HA, with herbage containing high concentrations of uNDF, intake is limited by the physical capacity of the animal, and it becomes a function primarily of dietary characteristics; for herbage containing low concentrations of uNDF, intake is controlled by the physiological energy demands of the animal, and is principally a function of animal characteristics.
Since there are variation in the NDF concentrations of pasture over the grazing period, reflecting the changes in the stage of maturity of plants and associated with variations of uNDF intake, the grid shows the expected variation in DMI (herbage, base diet and total DMI), when the herbage NDF change (%DM) around the current value, shown in the green column.
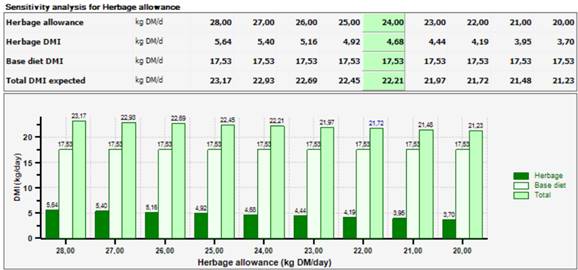
Sensitivity analysis for herbage allowance
The relationship between HA and PDMI depends on the levels of HA, the cutting height of the herbage and the level of production of the animals. The height of herbage sampling cut, above which HA is expressed, is an essential factor influencing the relationship between HA and PDMI. Herbage allowance is commonly measured at 3/5 cm above ground level (1.5/2 inches), but sometime it is measured at ground level.
Since HA plays a strong role in determining PDMI, as demonstrated by many studies, it might be of interest to evaluate DMI as HA change compared to the current input. The grid shows the expected variation in DMI (herbage, base diet and total DMI), when the herbage allowance change around the current value, shown in the green column.