The new Report Form also allows you to change the table properties: you can select which columns are displayed; you can change the font size and also change the columns width.
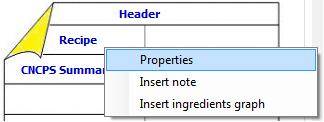
To change those properties, you need to right-click on the table name (or cell) in the Report Preview grid and select “Properties”:

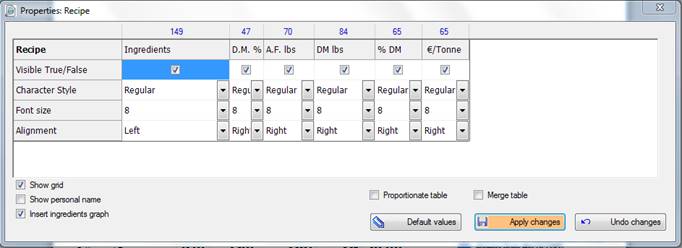
This will open the table’s Properties Form (in this example, we selected the Recipe table, but this works with all the tables):

In this form, you can change some table properties:
- To change the Columns width, you have to resize the column width in this table: you need to drag the column’ separator in the first row of the table. The numbers over each column represent the column's width value in pixel;
(Note: you can change more than one column's width selecting two or more columns before dragging the separator.)
In the Visible True/False row, you can tick or untick the selected column: the columns are displayed only if this check is checked.
- In the Character Style row, you can change the style of the font in Bold or Italic, etc;
- In the Font size row, you can choose the font size of the table or the column;
- In the Alignment row, you can decide the alignment of the column’s text;
- The Proportionate table check regulate the table total width.
- The Merge table check, if checked, does not allow the table to be split in two different pages: the table, if needed, will be placed in the next page instead of being split.
In the Recipe table, the “Character Style” and the
“Font size” rows can change the properties of each column; in all the other
tables of the Recipe report, those rows are related to all the table, and not to
each column. The “Alignment” row is displayed only in the Recipe
Table.
For the Recipe, you also have 3 General Properties:
- Show grid: if ticked, the Recipe table in the report will be displayed with the gridlines;
- Show personal name: if ticked, the Recipe table in the report will display the personal name of the ingredients instead of the conventional names;
- Insert ingredients graph: if checked, the ingredients graph will be displayed right to the Recipe table in the Report.
The Default values button reset the table’s properties to the default ones.
Apply changes will save the changes and refresh the Report, that will display the changes; Undo changes will go back to the Report without saving the changes.
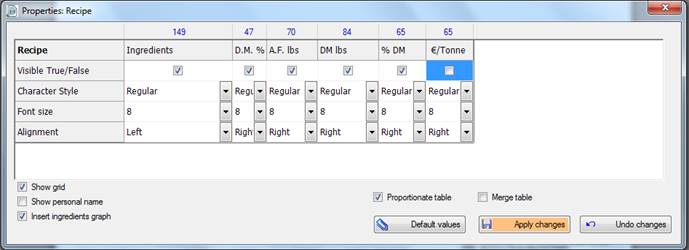
Example à removing the check from the ($/Ton) column, removing the Ingredient Graph option and checking Proportionate table in the Recipe properties:

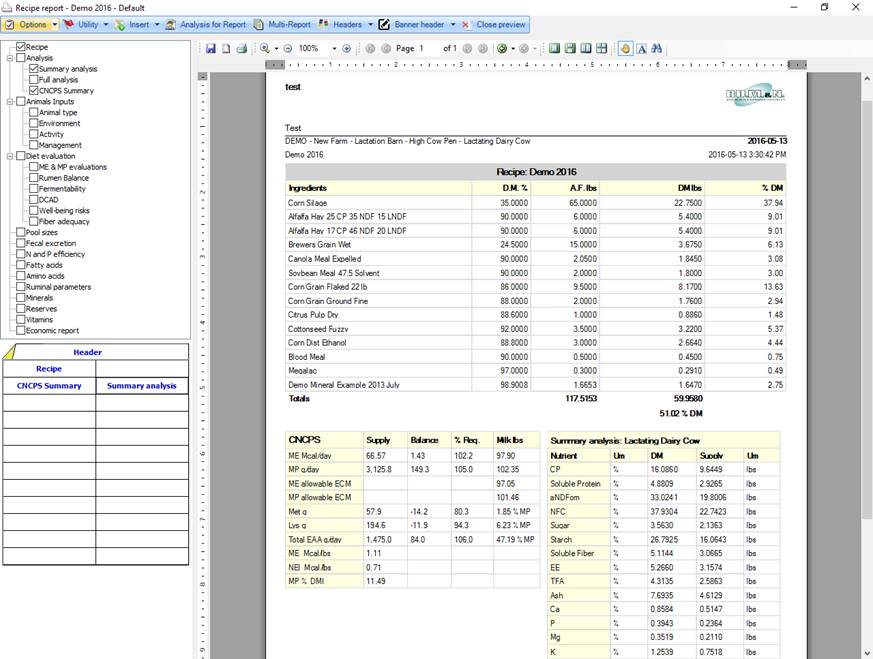
Selecting Apply changes will close the Properties and refresh the Report with the new changes:

Note: in this screenshot, the Ingredient Graph is removed. To do this you need to right-click on the “Ingredient Graph” and click on “Remove”. Alternatively, you can click on “Recipe” and select “Remove Ingredient Graph”. For more details please have a look at Ingredient Graph chapter below.